Power BI 101 @Rice
A progressive, Rice-specific starting point for accessing Power BI, finding shared reports, using basic report interactions, and asking careful questions when Copilot is enabled.
Follow the modules in order
This page is set up as a guided learning path. Each module can stand alone, but the sequence is designed to move someone from first access through building confidence with Rice Power BI reports.
Viewer path: This version is focused on people who consume Power BI reports. It covers access, report discovery, basic interactions, responsible export, and careful Copilot use where enabled.
Module 1
Power BI Viewer Training by EDBI
This viewer path is for Rice users who need to access Power BI reports, find the right dashboard, understand what they are seeing, and request access when a report is limited to an approved audience. It is designed for report consumers rather than report builders.
If you are new to Power BI, start with the question you are trying to answer or the decision your team needs to support. Power BI is most useful when you have a source of data and need to compare changes over time, track KPIs, monitor operational activity, identify trends, or give your team a shared view of important information.
This training path will help guide you on how to get access to existing reports, request a report to be built by EDBI, and use Power BI in general.
What You Will Learn
- How to sign in to Power BI with your Rice account.
- How to find reports shared through links, apps, and approved workspaces.
- How to request access from EDBI when a report is restricted.
- How to prepare a report request when your team needs a new dashboard or report.
- How EDBI-developed reports are usually delivered after they are built or shared.
- How to use slicers, filters, visual selections, and exports responsibly.
- How to ask careful questions when Copilot is enabled for a report.
What This Path Is Not
- Building reports in Power BI Desktop.
- Managing semantic models, refresh schedules, or data sources.
- Administering workspaces or report publishing pipelines.
- Exporting, re-sharing, or reusing governed data outside the approved purpose.
Module 2
Access Paths and EDBI Support
Start with a Report Request
EDBI is here to help you move from a business question to a useful report. The best place to start is by submitting a report request. If you are a beginner, you will most likely work with EDBI to have a report developed for your team, but we support users at every level, from people viewing their first dashboard to teams building more advanced Power BI and Fabric solutions.
When you submit a request, include what you are trying to solve or understand, who needs to use the report, what data source or system you are working from, and any examples of metrics, filters, or views that would help your team. After you submit the request, EDBI will reach out to learn more, confirm the best path forward, and start the report development process with you.
How Rice Users Typically Access Reports
After a report is developed or shared with you, you will usually access it in one of the following ways.
| Access path | What it means |
|---|---|
| dashboards.rice.edu | Preferred way to distribute EDBI-curated reports. Reports here are fully managed by EDBI and can be viewed by users in your department. |
| Workspace access | Gives your department a personal development area. A workspace can have access to EDBI-distributed reports and semantic models, but your department will need to add or remove users and appoint a data steward. |
| Shared enterprise report | Reports shared through the Power BI service can be found and searched by approved users. Microsoft notes that reports shared with you appear under Shared in the Browse tab, and Power BI search and filter tools can help you find reports, dashboards, apps, and other content. |
What EDBI Can Help Your Department Do
- Publish official dashboards: Create and maintain Power BI reports for department, business-area, or university-wide use.
- Set up governed access: Use approved publishing paths and security groups so the right users see the right reports.
- Connect to trusted data: Provide reporting-ready data from Rice’s Enterprise Data Platform through approved lakehouses, semantic models, or other curated sources.
- Support self-service reporting: Help teams understand when to use shared reports, when to request a new report, and when a department-built report makes sense.
- Improve data literacy: Train users to read dashboards carefully, check filters and refresh dates, export responsibly, and ask better questions of the data.
Module 3
Access Power BI
In this module, we will cover logging in to the Power BI service. The Power BI service is Microsoft’s cloud environment for publishing reports, sharing dashboards, and viewing analytics content that has been made available to you through Rice.
Step 1: Go to app.powerbi.com.
Step 2: Enter your [email protected] and click Submit.
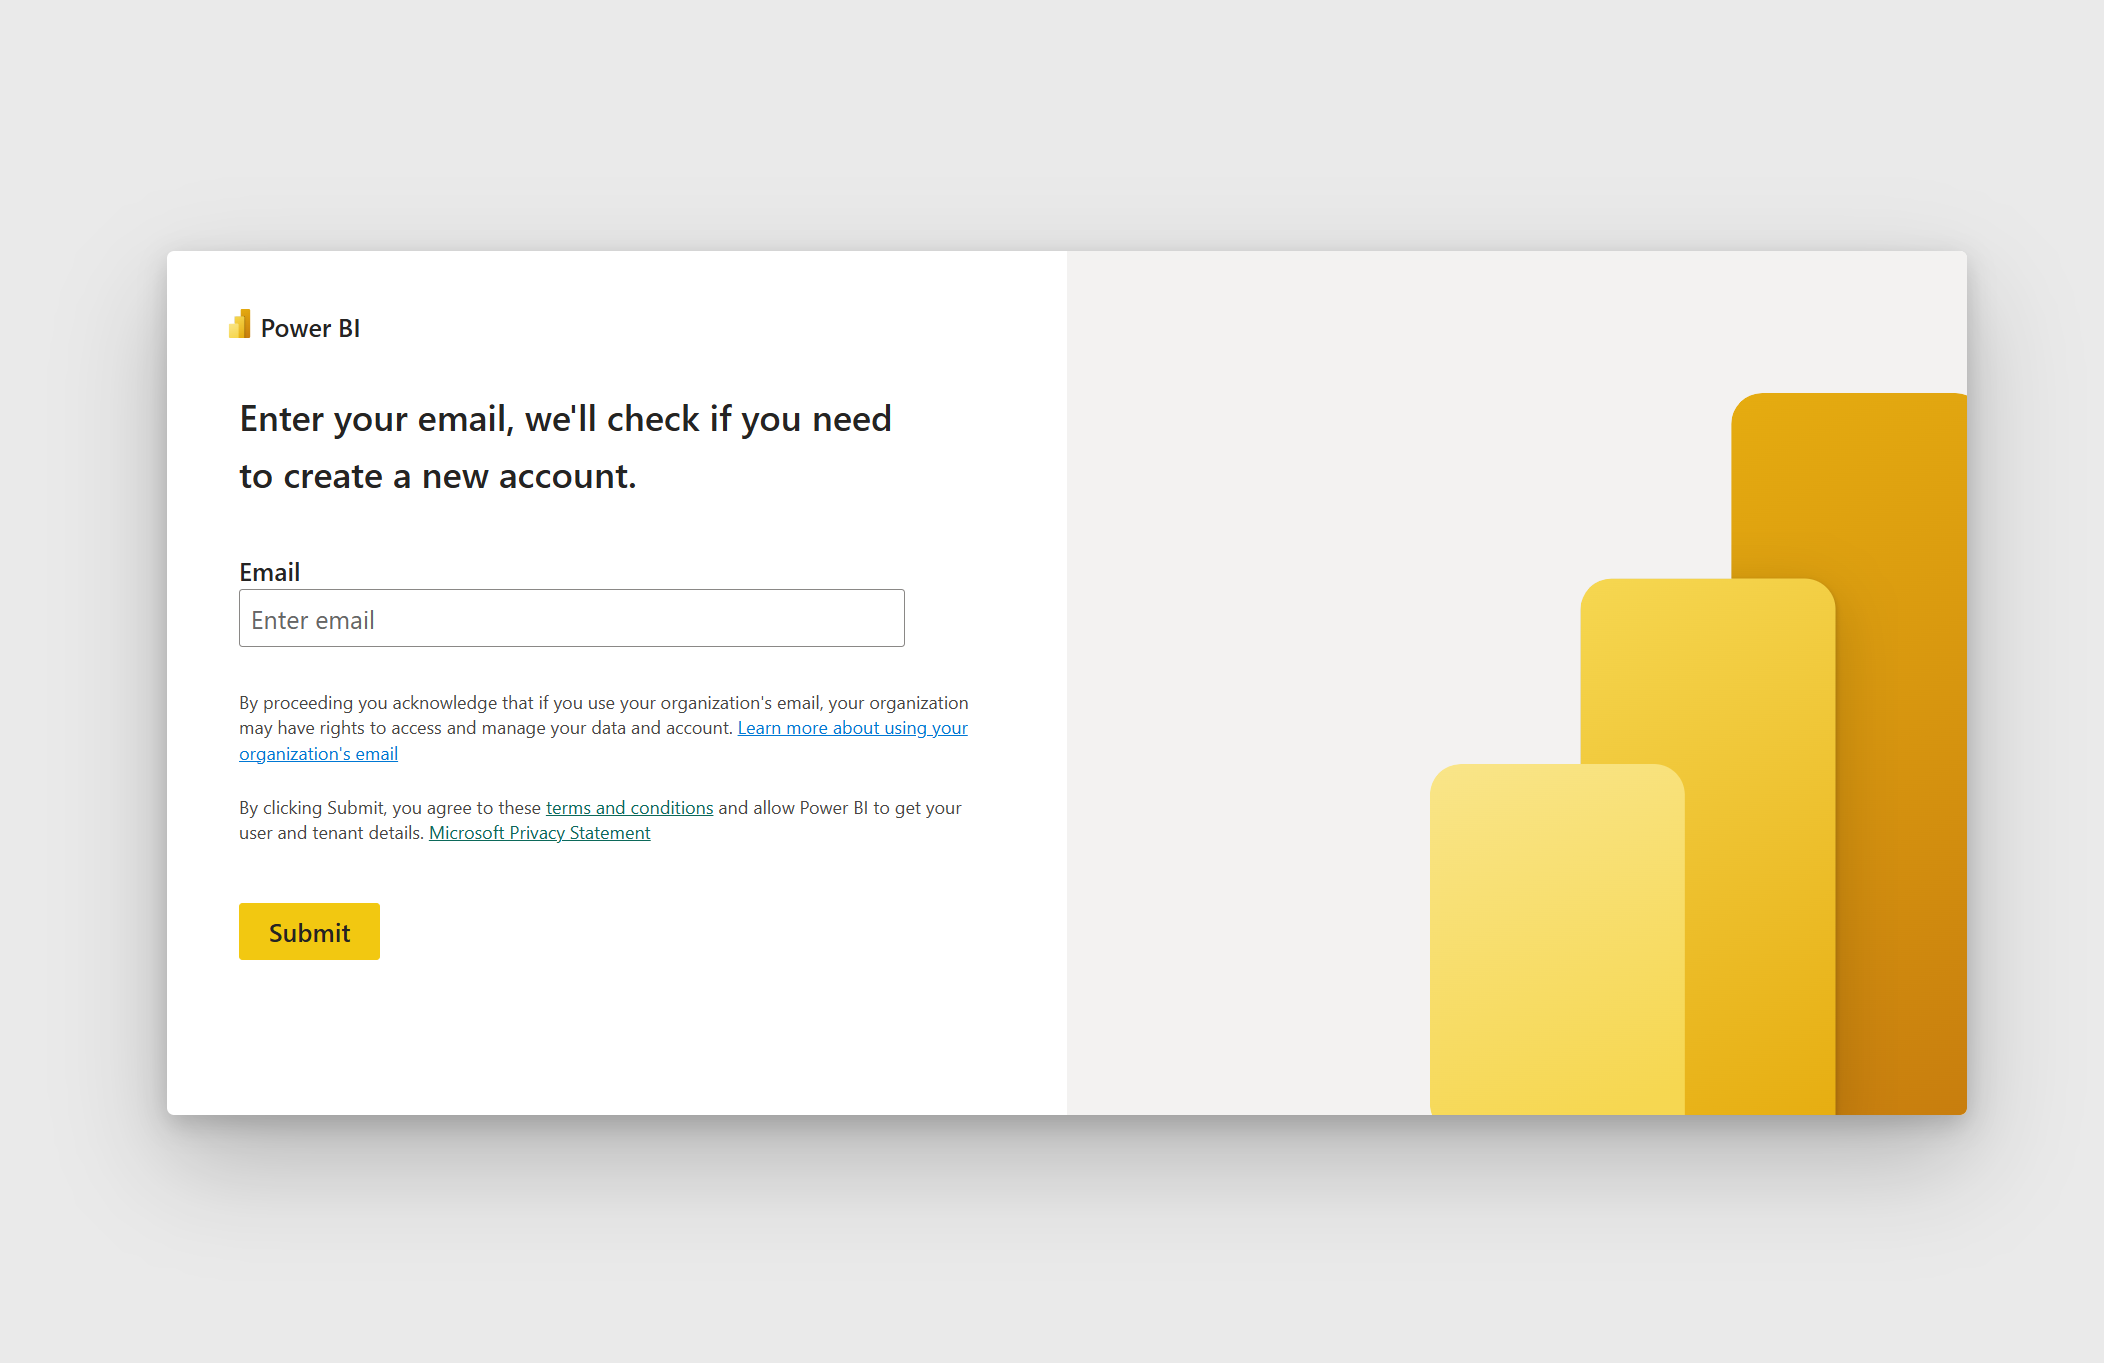
Step 3: If prompted, select Work or school account. Access to Power BI features is tied to your Rice account, not a personal Microsoft account.

Step 4: Enter your NetID password, and click Sign in.

Step 5: Authenticate with Duo Mobile.

You have now successfully logged in to your Power BI account. The page you are on is your Power BI personal workspace. Here you can build and publish reports for personal use and testing. If you create a report here and want to share it, you will need to download the file and give it to your teammates. Feel free to explore the options and get a feel for the environment.

In the next module, we will cover finding reports that have been shared with you.
If you are still having difficulty logging in, please submit a support request using this online form.
Module 4
Find Shared Reports
Reports can be shared with you in a few different ways. You may receive a direct link, see a report inside a Power BI app, or find content in a workspace where you have been granted access.
- Open the Power BI service at app.powerbi.com.
- Use the left navigation to check areas such as Apps, Browse, or Workspaces.
- If someone sent you a direct report link, open the link while signed in with your Rice account.
- If you cannot open the report, ask the report owner or submit a support request with the report name and business reason for access.
EDBI Developed Reports
Reports developed by EDBI will mostly be hosted at dashboards.rice.edu.
This Power BI app gives Rice-affiliated users a central place to find hosted reports developed and maintained by EDBI.
Below is a list of reports currently available in the app. If you would like access to one, please submit a request for access and include the report name and business reason for access.
Module 5
View, Slice, and Export Reports
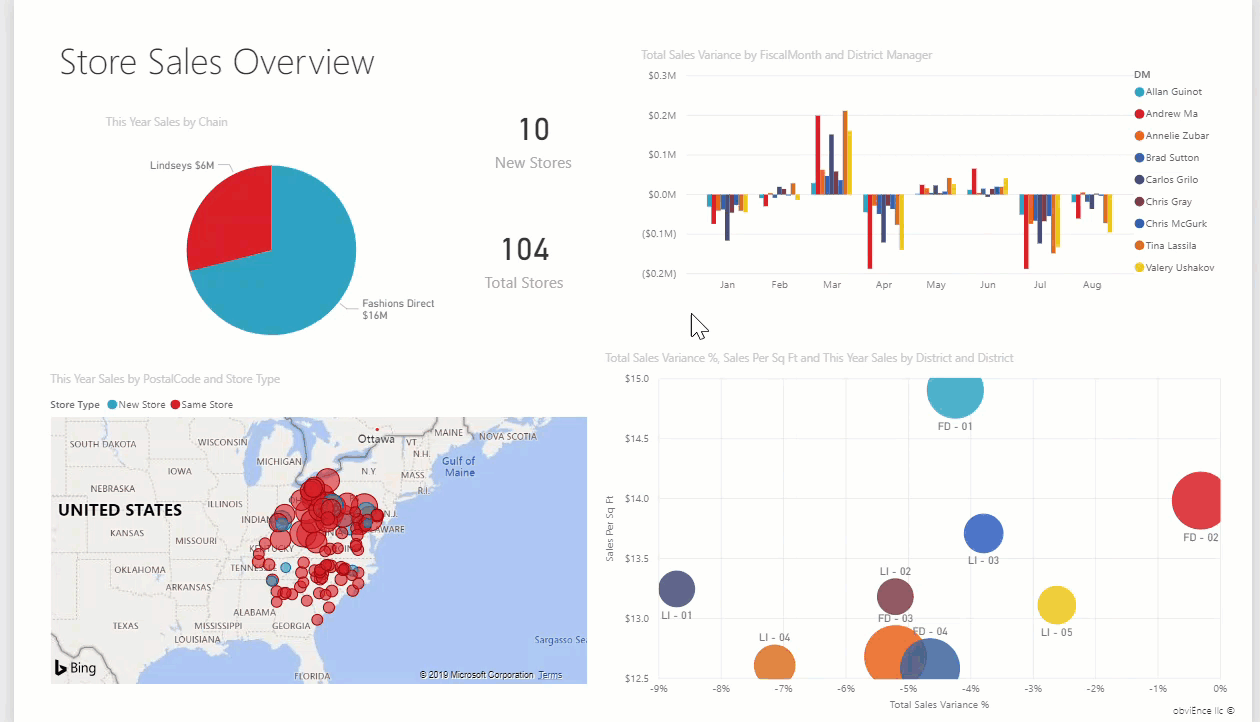
Viewing a report is designed to be intuitive and user friendly. Here are a few brief introductions to the main ways you can interact with Power BI reports as a viewer.
Use report slicers
Slicers are clickable filters built into the report page. They may appear as dropdowns, buttons, date ranges, or checklists. Select values from the available options to visualize only the data you have selected.
Select a visual
Some visuals are set to interact with other visuals on the page. Clicking bars on a chart, years on an axis, or categories in a visual can update the rest of the report page to that level of detail. You can usually see what is selected because unrelated data becomes more transparent, or the view changes to include only the selected values.
Exporting a table
If exporting is enabled and you have permission to export data, you can send the data behind a table or visual to Excel. Select the table or visual, open the visual options menu, and choose Export data. Depending on the report settings, Power BI may offer summarized data or underlying data.
Before exporting, check the active slicers, selected visuals, and report refresh date. Export only the data you need and handle the file according to Rice data use expectations.
Microsoft reference: Report highlighting and visual interactions in Power BI.
Module 6
Copilot in Reports
Some Power BI reports may include Copilot features. When enabled, Copilot can help summarize report content or answer questions about the data shown in the report. Treat Copilot responses as a starting point, not a final answer.
Use Copilot carefully
- Ask specific questions that name the metric, time period, population, or slicer context you care about.
- Check the visuals and slicer selections Copilot used before relying on the answer.
- Do not ask Copilot to interpret data you are not approved to use or share.
- Verify important answers against the report visuals, metric definitions, and business context.
Example prompts
| Instead of | Try |
|---|---|
| What happened? | Summarize enrollment changes by school for Fall 2025 compared with Fall 2024. |
| Is this good? | Which departments have the largest change in applications, and what slicers are currently selected? |
| Tell me about the report. | Summarize this page in three bullets and cite which visuals support each point. |
Microsoft guidance: Summarize a report with Copilot.
Power BI Copilot Training – link coming soon
After Power BI 101
Once these viewer modules are built out, this section can point learners to deeper Power BI creator training, Fabric training, Tableau comparisons, or a support request when they need help with a Rice-specific report.